A quick start to pypsignifit
This document presents two example analyses of psychometric function data using pypsignifit. The first example explains how to fit a psychometric function using constrained maximum likelihood as described in the papers by [Wichmann_and_Hill_2001a], [Wichmann_and_Hill_2001b]. The second example deals with a bayesian approach to fitting a psychometric function. Parts of the ideas for this can be found in the paper by [Kuss_et_al_2005], however most of this example is new at the time of this writing.
To get you starting with pypsignifit, open a python interpreter and type the following:
>>> from pypsignifit import *
>>> dir()
['BayesInference', 'BootstrapInference', 'ConvergenceMCMC', 'GInitiallyUnowned', 'GoodnessOfFit', 'ParameterPlot', 'ThresholdPlot', '__builtins__', '__doc__', '__name__', 'show']
As you see, there is a number of functions and data types imported in the current workspace. To view documentation about one of these functions, you can use the online python help by typing help ( function name ). For instance,
>>> help ( BayesInference )
will show the documentation of the BayesInference object class.
We will now create an example data set for which we want to estimate a psychometric function. We assume that the data are from a 2AFC task
>>> nafc = 2
>>> stimulus_intensities = [0.0,2.0,4.0,6.0,8.0,10.0]
>>> number_of_correct = [34,32,40,48,50,48]
>>> number_of_trials  = [50]*len(stimulus_intensities)
>>> data = zip(stimulus_intensities,number_of_correct,number_of_trials)
The last line creates a list of tuples of the form (stimulus intensity, number of correct responses, number of trials). Each tuple summarizes data from a single experimental block. We will assume that the data have been acquired in the same sequence in which they are entered, i.e. in the sequence of ascending stimulus intensity.
Example 1: Constrained Maximum Likelihood and Bootstrap Inference
Constrained maximum likelihood provides a way to estimate parameters from a psychometric function using maximum likelihood estimation while imposing constraints on some of the parameters. Typically, the psychometric function is parameterized as

where  is the guessing rate,
  is the lapsing rate,
  is a sigmoid function and
  and
and
 are parameters governing the shape of the sigmoid function. In this example, we will try to fit
the above data with a logistic function, using the same parameterization as in the original
psignifit software [Hill_2001]:
are parameters governing the shape of the sigmoid function. In this example, we will try to fit
the above data with a logistic function, using the same parameterization as in the original
psignifit software [Hill_2001]:

This is the default setting.
For a 2AFC task, the guessing rate is fixed at  . Thus, our model has three free parameters:
, , and . We want to keep and unconstrained and restrict to values between
0 and 0.1:
. Thus, our model has three free parameters:
, , and . We want to keep and unconstrained and restrict to values between
0 and 0.1:
>>> constraints = ( 'unconstrained', 'unconstrained', 'Uniform(0,0.1)' )
Now we can fit the psychometric function
>>> B = BootstrapInference ( data, priors=constraints, nafc=nafc )
>>> print B
< BootstrapInference object with 6 blocks and 0 samples >
>>> B.estimate
array([ 2.7517686 ,  1.45723724,  0.01555636])
>>> B.deviance
8.071331367479198
Here, we could have omitted the argument nafc=nafc in the call to BootstrapInference(). All inference functions assume a 2AFC task by default.
The code snippet shows, that is approximately 2.75, is approximately 1.46, and is approximately 0.016.
How well do these parameters describe the data? The deviance is a measure that describes the goodness of fit for a model. The deviance is approximately 8.07. Is this a
high or a low value? To know this, we have to draw a number of bootstrap samples:
>>> B.sample()
>>> print B
< BootstrapInference object with 6 blocks and 2000 samples >
We see that B has changed: instead of 0 samples, we now have 2000 parametric bootstrap samples in the object. We can use these samples to assess the goodness of fit
>>> GoodnessOfFit(B)
in an interactive session, this should open a window that looks like the following. (In some cases, you may have to type show() before you see the window).

The panel in the upper left displays the fitted psychometric function and the data points. In addition, some information about the fitted model is displayed and confidence intervals for thresholds at three levels are shown. The panel in the lower left displays a histogram of the deviances that were to be expected if the fitted model was perfectly correct. In addition, there are 95% confidence limits (dotted lines) and the observed deviance. If the observed deviance is outside th 95% confidence limits, this is an indication of a bad fit. The plot in the middle on top plot deviance residuals against the predicted correct response rate of the model. This plot helps to detect systematic deviations between model and data. Trends in this graph indicate systematic differences between model and data. The dotted line is the best linear fit that relates deviance residuals to the predicted correct response rate. The correlation between model prediction and deviance residuals is shown in the plot. The plot in the middle at the bottom shows a histogram of these correlations under the assumption that the fitted model is perfectly correct. Again the dotted lines denote 95% intervals of the correlations and the solid line marks the observed correlation between model prediction and deviance residuals. If the obsered correlation is outside the 95% interval, this indicates a systematic deviation of the model from the data. The two plots on the right follow the same logic as the plots in the middle. The difference is that in this case deviance residuals are plotted agains block index, i.e. the sequence in which the data were acquired. If the observer was still learning the task, this should be visible in this plot.
We can also get a graphical representation of the fitted parameters:
>>> ParameterPlot(B)
in an interactive session, this should again open a window showing estimated densities of the model parameters as shown below. (Again, you might have to type show() to see the window).

Each of these plots shows the estimated density of one of the model parameters. In addition, the estimated parameter is marked by a solid vertical line and the 95% confidence interval is marked by dotted vertical lines. The confidence interval limits and the estimates are written on top of the graph.
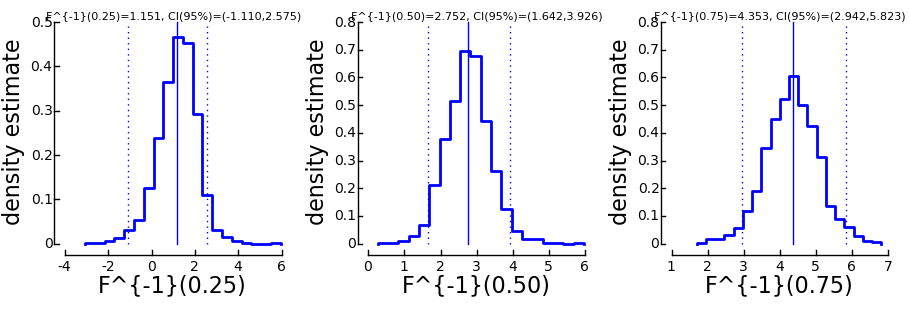
In some cases, we may not directly be interested in the parameters of the model. Instead, we
ask for “thresholds”, that is predifined performance levels of the sigmoid . We can get a plot
of such thresholds and the associated confidence intervals using the function
>> ThresholdPlot(B)
the image looks essentially the same as for the ParameterPlot only that this time, the threshold(s) of the model are displayed.
Sensitivity Analysis
As noted by [Wichmann_and_Hill_2001b], bootstrap based confidence intervals are in many cases too small. That is, a 95% confidence interval contains the true parameter in less than 95% of the cases. [Wichmann_and_Hill_2001b] propose a sensitivity analysis to determine the misestimation of confidence intervals and correct for this error. The BootstrapInference object can perform a sensitivity analysis. Afterwards, the confidence intervals will be expanded to compensate for the underestimation of the confidence intervals.
>>> B.getCI(1)
array([ 1.64202158,  3.92605858])
>>> plotSensitivity(B)
>>> B.getCI(1)
array([ 1.29922527,  4.17696559])
As you see the second call to the getCI() method returns slightly wider confidence intervals. These confidence intervals have been extended to provide more realistic coverage. In addition, the plotSensitivity() function should open a plot window showing something like this:

This shows the joint probability distribution of the parameters and of the model. The dark shading
indicates the density of this joint distribution as estimated from the bootstrap parameters. The red dot
in the center of the cloud of points is the parameter estimate that was determined by maximum likelihood.
The red diamonds that are connected by red lines are the points at which an additional bootstrap sample
has been drawn. The expanded bootstrap confidence intervals correspond to the widest confidence intervals
from all points that are marked in red (i.e. the maximum likelihood estimate and the points marked by
the red diamonds).
Reparameterizing the model
pypsignifit reformulates the function  by means of two separate functions
  and
and  . We can think of
  as the nonlinear part of the psychometric function, while
 is in most cases linear in x. Often g can be changed without seriously altering the possible
model shapes. In pypsignifit is called the ‘sigmoid’ and is called the ‘core’. Using different
combinations of sigmoid and core allows a high flexibility of model fitting. For instance
Kuss, et al (2005) used a parameterization in terms of the ‘midpoint’
is in most cases linear in x. Often g can be changed without seriously altering the possible
model shapes. In pypsignifit is called the ‘sigmoid’ and is called the ‘core’. Using different
combinations of sigmoid and core allows a high flexibility of model fitting. For instance
Kuss, et al (2005) used a parameterization in terms of the ‘midpoint’  of the sigmoid and the
‘width’
of the sigmoid and the
‘width’  . Here width is defined as the distance
  . To
perform BootstrapInference for this model we can proceed as follows
. To
perform BootstrapInference for this model we can proceed as follows
>>> Bmw = BootstrapInference ( data, sample=2000, priors=constraints, core="mw0.1", nafc=nafc )
>>> Bmw.estimate
array([ 2.75176858,  6.40375494,  0.01555636])
>>> Bmw.deviance
8.0713313674704921
>>> Bmw.getThres()
2.7517685843037913
>>> Bmw.cuts
(0.25, 0.5, 0.75)
>>> Bmw.getCI(1)
array([ 1.4842732 ,  4.06407509])
Note that this model has the same deviance as the model fitted above. Also the obtained thresholds are the same. However, as the parameterization is different, the actual fitted parameter values are different. More details on sigmoids and cores and how they can be used to specify models can be found in the section about Specification of Models for Psychometric functions
Example 2: Bayesian inference
Bayesian inference follows a slightly different logic than conventional frequentist inference.
- In a bayesian framework, probability is used to quantify uncertainty. As the data are perfectly certain (we measured them), the data are typically considered fixed. In contrast, the parameters are uncertain (we don’t know them). Thus, the parameters are modeled as random variables.
- In a bayesian framework, it is not common to simply consider a single value of a parameter.
Instead, we want to get an idea of the so called ‘posterior’ distribution. That is the distribution
of parameters (and the associated uncertainty about parameters) that is left after having
observed the data. The posterior distribution is in most cases relatively easy to write down
up to a constant factor. This gives rise to two problems
- The posterior distribution is not a proper probability density function. In order to work with it as a probability distribution, we may want to normalize the posterior to have an integral of 1.
- We need to summarize the potentially high dimensional posterior distribution. That means we are looking for expectations, quantiles, marginal distributions, ...
Bayesian methodology typically starts by quantifiing the uncertainty about parameters in a Situation when no data have been observed. The distribution describing this uncertainty is called the prior distribution. We set up prior distributions for all parameters in the model:
>>> priors = ( 'Gauss(0,5)', 'Gamma(1,3)', 'Beta(2,30)' )
Typically we don’t know much about the parameters without having observed the data. Thus, we will usually be looking for relatively flat priors that give equal probability to all parameter values. These priors are not flat. They were chosen here to demonstrate the interaction between prior and data in generating the posterior distribution.
In accordance with Kuss et al (2005), the default parameterization for psychometric functions for
Bayesian inference is the mw-parameterization. That means, the core object of the psychometric
function is defined in terms of a ‘midpoint’ of the sigmoid and the ‘width’ . As explained above
can be interpreted as the length of the interval on which rises from  to
to  . In
the default parameterization,
. In
the default parameterization,  .
.
The priors we defined above say in words that
- We believe that the midpoint of the psychometric function will be somewhere around 0 with a variance of 5.
- We believe that the widths of the psychometric function is positive (the Gamma distribution is 0 for negative values) and most probabily somewhere around 3.
- We feel like having observed 30 trials in which 1 trial was a lapse and 29 were not.
More information about prior selection can be found in the section Bayesian model fitting and prior selection.
We will now set up a data object that allows inference based on the posterior distribution of parameters given the observed data.
>>> mcmc = BayesInference ( data, priors=priors, nafc=nafc )
>>> mcmc.estimate
array([ 2.54226166,  7.10800435,  0.02670357])
>>> mcmc.deviance
8.8533301101840411
As we can see, the BayesInference object knows a single number as an estimate for the parameters:
seems to be approximately 2.54, seems to be approximately 7.11 and the lapse rate seems to
be somewhere around 0.027. These numbers are averages of the posterior distribution. How accurate are they? Can we trust in them?
Convergence diagnostics
As mentioned above in point 2, the posterior distribution that we can directly write down is only proportional to the ‘real’ posterior probability distribution. The get an idea about the probability distribution, the BayesInference object uses a technique called markov chain monte carlo (MCMC) to draw samples from the posterior distribution. This simplifies a number of problems: Expectations reduce to simple averages over the samples from the posterior distribution, quantiles of the posterior distribution can be estimated as quantiles of the samples, ... Unfortunately this simplification comes at a price. The sampling procedure steps from one sample to the next, to make sure that eventually the samples are from the posterior distribution. In other words: The first M samples are usually not from the posterior distribution but after that the typically are. Furthermore, it is important to know whether the samples really cover the whole posterior distribution or whether they remain in a restricted area of the posterior distribution. These points are summarized under the term convergence. Although the BayesInference object will in most cases try to use sensible parameters for the sampling procedure (using a procedure by [Raftery_and_Lewis_1996] to ensure these points, it might be that the chains did not converge.
A good strategy to access convergence is to simply use multiple chains and to check whether they eventually sample from the same distribution. Currently, we have one chain of samples:
>>> mcmc.nchains
1
We draw two more chains from starting values that are relatively far away from our estimate above:
>>> mcmc.sample ( start = (0,1,0.01) )
>>> mcmc.sample ( start = (6,11,0.3) )
>>> mcmc.nchains
3
>>> mcmc.Rhat ( 0 )
1.0026751756394505
As we can see, now there are three chains. The last line compares all three chains. This value
is the variance between chains devided by the variance within chains as suggested by [Gelman_1996].
If there are large differences between chains, the variance between chains will
be very high and thus  will be very high, too. If is larger than 1.1, this is typically an
indication, that the chains did not converge. In the example above, is nearly exactly 1 for
parameter 0 (which is ). Thus, we can be quite sure that the samples of where from the
posterior distribution of . To see the same for the other two parameters, and , we can
say:
will be very high, too. If is larger than 1.1, this is typically an
indication, that the chains did not converge. In the example above, is nearly exactly 1 for
parameter 0 (which is ). Thus, we can be quite sure that the samples of where from the
posterior distribution of . To see the same for the other two parameters, and , we can
say:
>>> mcmc.Rhat ( 1 )
1.0017846605347036
>>> mcmc.Rhat ( 2 )
1.0003879076929894
Thus, all three chains seem to sample from at least the same distribution of parameters and we conclude that it is very likely that this distribution is indeed the posterior distribution. To get an even better idea, we can also look at a convergence plot:
>>> ConvergenceMCMC ( mcmc )
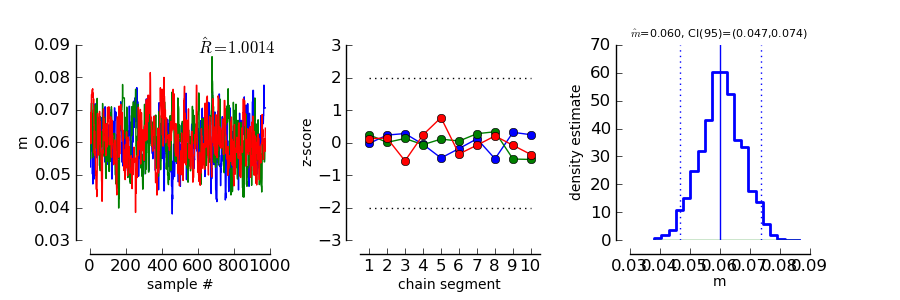
This plot consists of three panels. The first simply shows the three chains in three different
colors. These chains should look like a “hairy caterpillar” and they should not differ statistically
from each others.This seems to be the case. In addition, the plot shows The estimate we had
already seen above.
The second plot in the middle shows a convergence criterion proposed by [Geweke_1992]: Every chain first Z-standardized to have mean 0 and standard deviation 1. Then the chain is split in 10 segments. If one of these chains deviates more than two standard deviations from the mean, this is a sign that the chain is not stationary. In that case, it might be that the chain does not sample the whole posterior distribution, or does not sample the posterior distribution at all! In the middle segment of our graphic, all chains seem to be reasonably stationary. Thus, there is good reason that these chains really sample from the posterior distribution of parameters.
The third plot on the right shows the marginal posterior density estimated from all three chains taken together (blue staircase curve). In addition, the prior density is plotted (green line) and three vertical lines. The solid vertical line markes the posterior mean, the two dotted curves mark the 2.5% and the 97.5% percentiles. This plot gives us a good idea of the posterior distribution of m. There are no strange outliers or discontinuities. For our special case, this is again good evidence that the chains really converged.
If we want to select a particular parameter to access convergence, we can use the parameter argument
>>> ConvergenceMCMC ( mcmc, parameter=1 )
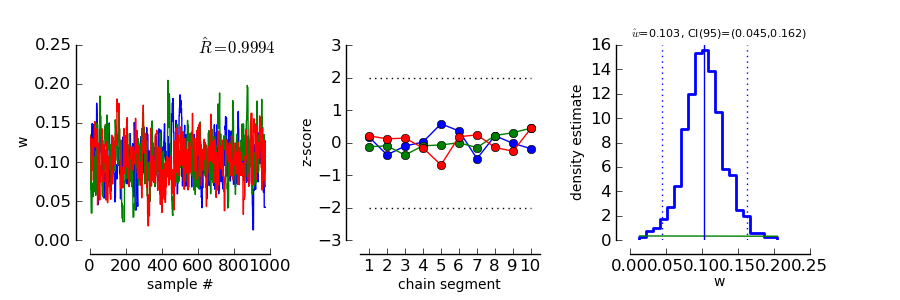
The plot is of course the same for the interpretation. However, in this case the prior is a Gamma(1,3) distribution that is only defined for positive numbers. Again, the chains seem to have converged. However, the data clearly indicate a width that is larger than the widths given by the prior.
Goodness of fit
We can now use the same goodness of fit function as for the BootstrapInference object:
>>> GoodnessOfFit ( mcmc )

The structure of the plot is very similar to the goodness of fit plot for the BootstrapInference object. However, the interpretations should now be taken from a bayesian perspective.
The upper left panel shows psychometric functions sampled from the posterior distribution, data, and credibility intervals for three thresholds. Data and credibility intervals have essentially the same interpretation as before. However, this time, we have multiple psychometric functions to describe the data. The dark blue curve (on which the credibility bar are fixed) indicates the curve corresponding to the mean of the psychometric function. The other curves in light blue with different saturation correspond to samples from the posterior distribution. The saturation of the color of the curve is proportional to the likelihood of the psychometric function, that is the part of the posterior distribution that represents the influence of the data.
The plot on the lower left shows posterior predictive deviances. For each sample from the posterior distribution, a data set has been generated. The deviance associated with the posterior samples and the observed data set is plotted against the deviance of these simulated data sets for the psychometric functions associated with the samples from the posterior distribution. If the observed data are likeli to come from the fitted model, all the points in this plot should lie around the diagnonal. If the plots are mainly above the diagonal, the deviances of the observed data are higher than expected for data the originate from the fitted model. It is possible to calculate a “Bayesian p-value” that lies between 0 and 1. Values close to 0 or 1 indicate a bad fit in this case.
The two plots of posterior correlation between model prediction and deviance residuals and between block index and deviance residuals are essentially the same as this plot. The only difference is, that in this case it is not the deviance that is calculated for each posterior predictive sample but it is the respective correlation. Interpretation of these plots is analog to the interpretation of the respective plot for the posterior deviance.
We can observe that in all cases, the fitted model describes the data reasonably well.
Posterior distributions
To get an idea of the posterior parameter distributions, we can again use the function
>>> ParameterPlot ( mcmc )
resulting in plots of the estimated posterior density of all model parameters (blue staircase) as well as the priors associated with the respective model parameters (green lines).
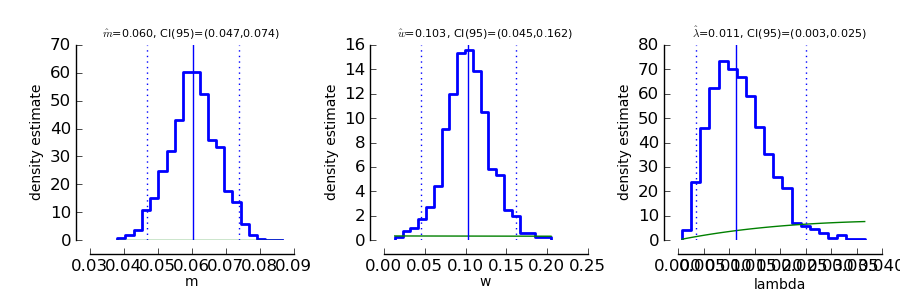
The interpretation of these plots is straigtforward. Also the ThresholdPlot() function that we applied to the bootstrap data in the first example can be used for Bayesian inference.
References
| [Hill_2001] | Hill, NJ (2001): Testing Hypotheses About Psychometric Functions. PhD Thesis, Oxford. |
| [Kuss_et_al_2005] | Kuss, M, Jäkel, F, Wichmann, FA (2005): Bayesian inference for psychometric functions. J Vis, 5, 478-492. |
| [Wichmann_and_Hill_2001a] | Wichmann, FA, Hill, NJ (2001a): The psychometric function: I. Fitting, sampling, and goodness of fit. Perc Psychophys, 63(8), 1293-1313. |
| [Wichmann_and_Hill_2001b] | (1, 2, 3) Wichmann, FA, Hill, NJ (2001b): The psychometric function: II. Bootstrap-based confidence intervals and sampling. Perc Psychophys, 63(8), 1314-1329. |
| [Gilks_et_al_1996] | (1, 2) Gilks, WR, Richardson, S, Spiegelhalter, DJ (Hrsg,1996): Markov chain Monte Carlo in practice. London: Chapman & Hall. |
| [Raftery_and_Lewis_1996] | Raftery & Lewis (1996): Implementing MCMC. In [Gilks_et_al_1996]. |
| [Gelman_1996] | Gelman A (1996): Inference and monitoring convergence. In [Gilks_et_al_1996]. |
| [Geweke_1992] | Geweke, J (1992): Evaluating the accuracy of sampling-based approaches to calculating posterior moments. In Bernardo et al., pp 169-193. |
![]()
Table Of Contents
Previous topic
Next topic
Detecting influential observations using psignifit