Specifying the shape of the psychometric function
In this section you can find some more information about the different shapes your psychometric function can take. Which one you go for is mainly dictated by your data but you should also take theoretical aspects into account.
A variety of different parametric shapes for psychometric functions have been used. In probit analysis for example, the data are essentially fit by a cumulative gaussian; visual contrast detection data have been reported to be well fit by a weibull distribution function. Fitting visual contrast detection with a weibull function is also theoretically appealing because it corresponds to the quick pooling model ([Graham_1989] p. 165).
Psignifit supports a relatively large number of psychometric function shapes. These are selected using two keywords: ‘sigmoid’ and ‘core’ (this is independent of whether you are using bootstrap or Bayes). To understand the meaning of these two keywords, let us take a look at the model that psignifit tries to fit:

Here,  is a parameter vector (in forced choice tasks
  is fixed). The critical term
that determines the shape of the psychometric function is
is fixed). The critical term
that determines the shape of the psychometric function is  . We decompose
 in two functions, a scalar function
  and a higherdimensional function
  , such that

In many cases (but not all),  will be a simple linear transformation, while
  will inject a
nonlinearity. We will call the ‘sigmoid’ and the ‘core’.
will inject a
nonlinearity. We will call the ‘sigmoid’ and the ‘core’.
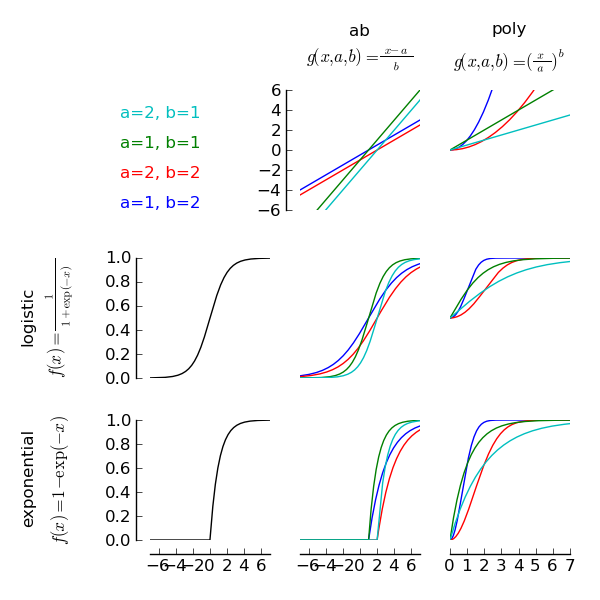
The figure illustrates how sigmoid and core are related to each other. A sigmoid does not have any parameters. Thus,
fitting a psychometric function with only a sigmoid would always result in the same psychometric function. Two such sigmoids
are shown in the left column of the figure: The first is a logistic sigmoid and the second is the cumulative distribution function of
the standard exponential distribution. In order to have parameters that describe the shape of the psychometric function, we use a core
object. The top row of the figure illustrates two core objects: the first is an abCore that can be requested with the keyword ‘ab’.
We can see that the output of this core is simply a linear function of  . However, the slope and intercept of this linear function
depends on the two parameters
. However, the slope and intercept of this linear function
depends on the two parameters  and
and  . The second plot in the first row illustrates a polyCore, as requested with the
keyword ‘poly’. Note that the poly core is a nonlinear function of . Again, the two parameters and determine the
precise form of the nonlinear function. In order to illustrate the fact that each core object represents a large number of different
functions in , four different combinations of and have been plotted.
. The second plot in the first row illustrates a polyCore, as requested with the
keyword ‘poly’. Note that the poly core is a nonlinear function of . Again, the two parameters and determine the
precise form of the nonlinear function. In order to illustrate the fact that each core object represents a large number of different
functions in , four different combinations of and have been plotted.
The four plots in the lower right of the figure demonstrate how sigmoids and cores can be combined to allow for a large number of possible psychometric function shapes. For instance, the lower right plot is a combination of the Exponential sigmoid and the poly core. The resulting function is the cumulative distribution function of the weibull distribution. The combination of logistic sigmoid and ab core corresponds to the logistic function that was the default setting in earlier versions of psignifit. The advantage of separating sigmoid and core is that we can now use a different core object, to specify that a function should be fitted on different axes (e.g. logarithmic instead of linear) or in a different parameterization. Also note, that the figure only presents two sigmoids and two cores. This results in two different function families for the psychometric function. Psignifit includes 6 different sigmoids and 5 different cores, resulting in 30 different function families.
The following two sections describe the sigmoids and cores in more detail. Then finally, there is a section about common combinations of sigmoids and cores.
Valid sigmoids
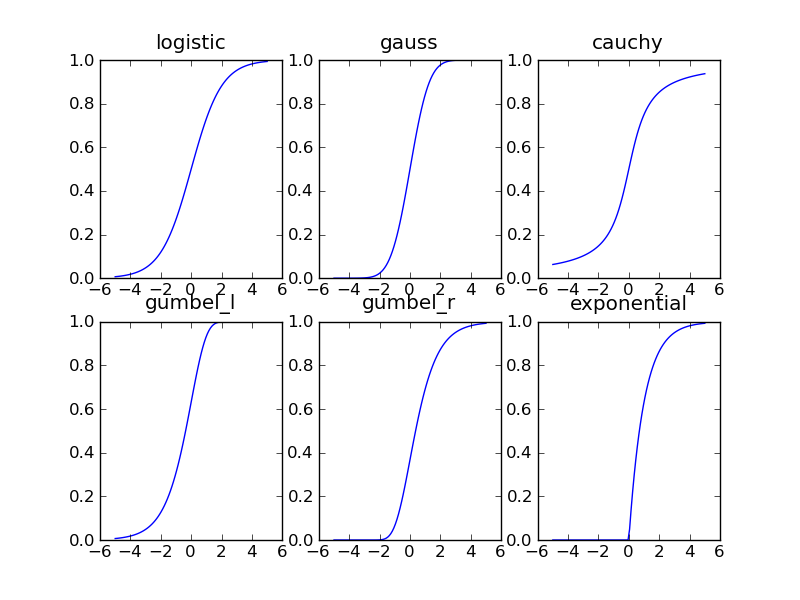
Six different sigmoids can be selected. All of them correspond to cumulative distributions functions.
- logistic
- the logistic function
 . This sigmoid is symmetric with respect to
the point (0,0.5).
. This sigmoid is symmetric with respect to
the point (0,0.5). - gauss
- the cumulative distribution function of the standard normal distribution. This function is symmetric to the point (0,0.5), too. Combined with one of the linear cores, selecting this sigmoid roughly corresponds to probit analysis (although typically, the confidence intervals will differ).
- cauchy
- the cumulative distribution of the cauchy distribution (i.e. the t-distribution with
1 degree of freedom). this sigmoid is symmetric with respect to the point (0,0.5).
Because the cauchy distribution is a heavy tailed distribution, this sigmoid is less
sensitive to lapses an inaccuracies in at extreme x values. Here,
 .
. - gumbel_l
- the cumulative distribution function of the left gumbel. This function is not symmetric:
it first increases slowly for negative values and then approaches 1 rather quickly. The
left gumbel can be used to define a left weibull if combined with a proper (nonlinear)
core. However, also with a linear core, the left gumbel may be a reasonable choice. Here,
 .
. - gumbel_r
- the cumulative distribution function of the right gumbel. Actually, this is not the
classical gumbel distribution but its reverse, that corresponds to replacing x by -x in
the left gumbel, thus
 .
. - exponential
- the sixth sigmoid is the cumulative distribution function of the exponential distribution.
That is
 if
if  , and
, and  else. This function is clearly not
symmetric.
else. This function is clearly not
symmetric.
Valid cores
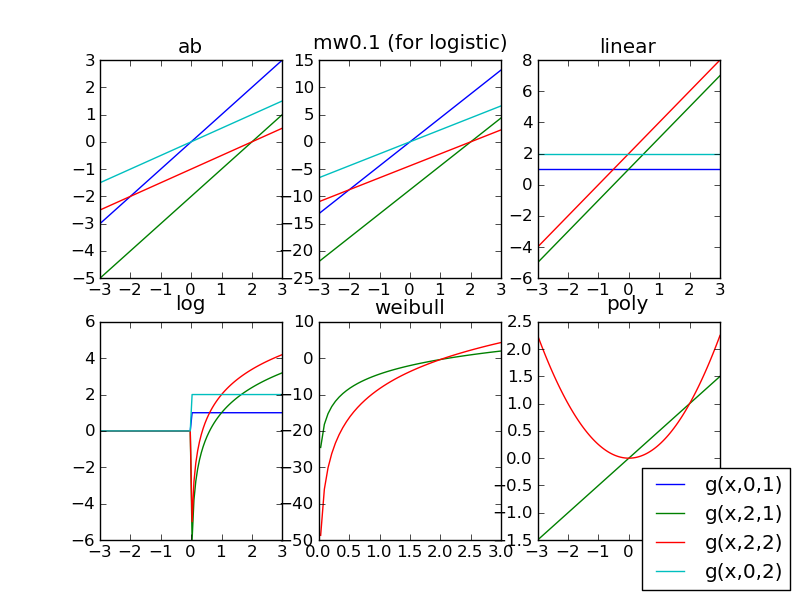
There are also six different cores to be selected. The first three are simply linear transformations of the stimulus intensities. The remaining three cores are nonlinear transformations. Typically, these will be needed to define a weibull function.
- ab
- the ab-core corresponds to the transformation that transforms an arbitrary normal
distribution to the standard normal distribution. It is given by
 .
For all symmetric sigmoids, this corresponds to the classical psignifit parameterization.
.
For all symmetric sigmoids, this corresponds to the classical psignifit parameterization. - mw
- the mw-core is similar to the ab-core in that it is a linear transformation, too.
However, the parameters now have a useful meaning. The first parameter is the “midpoint”
of the combination
 (i.e. the threshold), while the second parameter is the “width”
of the interval over which the psychometric function is rising. What exactly “rising”
means in this context is given by an additional parameter such that selection of
an mw core is performed using a keyword like ‘mw0.1’ or mw0.05’. For an ‘mw0.1’ core,
the width parameter is defined as the width of the interval over which the function
rises from 0.1 to 0.9. In general, the width of an ‘mwalpha’ core is the width of
the interval over which the function rises from
(i.e. the threshold), while the second parameter is the “width”
of the interval over which the psychometric function is rising. What exactly “rising”
means in this context is given by an additional parameter such that selection of
an mw core is performed using a keyword like ‘mw0.1’ or mw0.05’. For an ‘mw0.1’ core,
the width parameter is defined as the width of the interval over which the function
rises from 0.1 to 0.9. In general, the width of an ‘mwalpha’ core is the width of
the interval over which the function rises from  to
to  . Obviously
  depends
on the sigmoid. However, in general the mw-core has a form
depends
on the sigmoid. However, in general the mw-core has a form  ,
with
,
with  derived from the shape of f.
 - linear
- another linear transformation of the input intensity: here, we simply have
 .
Although this is the most direct way to implement an (affine) linear transform of the
input it is at the same time the least interpretable. Therefore, we recommend to avoid
this core.
.
Although this is the most direct way to implement an (affine) linear transform of the
input it is at the same time the least interpretable. Therefore, we recommend to avoid
this core. - log
- similar to the linear core but on logarithmic coordinates. This is particularly useful
for contrast detection data. The weibull function that is commonly used to fit contrast
detection data is obtained if the gumbel_l sigmoid is used with the log core. The log core
is given by

- weibull
- the weibull core is at the heart very similar to the log core. However, in contrast to the
log core, the weibull core uses more meaningful parameters: the first parameter can be
interpreted as some sort of “midpoint” (i.e. threshold) and the second parameter gives
the slope at the midpoint of the weibull that results with a gumbel_l sigmoid. The weibull
core is
 .
. - poly
- While the weibull and the log core perform at the heart a fit on a logarithmic axis, this
core performs something clearly different:
 . In combination with a exponential
sigmoid, this gives the parameterization used in the classical psignifit version.
. In combination with a exponential
sigmoid, this gives the parameterization used in the classical psignifit version.
Combining sigmoids and cores
As already mentioned above, combinations of ‘sigmoid’ and ‘core’ determine the shape of the nonlinear
function  . There are some shapes that are particularly interesting in psychophysical
applications. This section explains how to obtain these typical shapes.
. There are some shapes that are particularly interesting in psychophysical
applications. This section explains how to obtain these typical shapes.
Logistic function
In this case, we combine the ‘logistic’ sigmoid with one of the linear cores (ab,mw,linear). Depending on the core used, this results in different parameterizations.
- logistic + ab
- This is the standard parameterization of the old psignifit version that was based on bootstrapping.
can be interpreted as the 75% threshold and
 as a scaling factor that is inversely
related to the slope of the psychometric function.
Here we obtain:
as a scaling factor that is inversely
related to the slope of the psychometric function.
Here we obtain:

- logistic + mw
- This parameterization was used in [Kuss_et_al_2005] for Bayesian inference on psychometric functions. It reads:

where. This allows
to be interpreted as the 75% threshold and
rises from
to
. A typical choice for
- logistic + linear
- This parameterization corresponds to the classical parameterization used in the literature about generalized linear models. Here, the psychometric function is modelled as

This parameterization does not allow a psychophysically meaningful interpretation of the parameters.
Cumulative Gaussian
The cumulative gaussian is obtained by combining the gauss sigmoid with one of the linear cores (ab,mw,linear).
The parameterizations are precisely the same as for the logistic function with one exception:
The scaling factor z(alpha) for the mw parameterization is  , where
  is the inverse of the the cumulative gaussian.
Cumulative Gumbel
Also for the cumulative Gumbel sigmoids, the parameterizations are similar to the logistic function. However, the Gumbel distribution is skewed. This implies that the alpha parameter of the ab parameterization can not be interpreted as a 75% threshold. For the mw parameterization this is solved in a different way. The lgumbel + mw function is parametrized as follows:

where  .
.
Weibull
There are a number of ways to parametrize the Weibull function.
- exponential + poly
- The classical way is probably

which is implemented using the combination of an exponential-sigmoid and a poly-core.
- gumbel + weibull
- The Weibull function is equivalent to a Gumbel sigmoid on logarithmic coordinates. Thus, [Kuss_et_al_2005] suggested a parameterization in terms of the 75% threshold m and the slope at the threshold s. This results in the following equivalent form

- gumbel + log
- As the Weibull is a Gumbel fitted on log coordinates, a Weibull can also be obtained using a gumbel sigmoid and the log-core, which results in the following parameterization

References
| [Graham_1989] | Graham, NVS (1989): Visual Pattern Analyzers. New York: Oxford University. |
| [Kuss_et_al_2005] | (1, 2) Kuss, M and Jäkel, F and Wichmann, FA: Bayesian inference for psychometric functions Journal of Vision, 5, 478-492. |
![]()
Table Of Contents
Previous topic
Specifying the experimental design
Next topic
Bayesian model fitting and prior selection